 Internet
Resources for the Bay Area Diver
Internet
Resources for the Bay Area Diver
Chuck Tribolet, triblet@garlic.com.
This article first appeared in the October, 1997 issue of the newsletter of the Northern California Underwater Photographic Society, and since been enhanced and made more web-friendly.
© Copyright The Underwater
Photographic Society, Northern California
Chapter, 1997
© Copyright, Chuck Tribolet, 1997, 2005
I'm not going to try to explain the differences between web pages, mailing lists, private e-mail, and Usenet groups. Get your local web guru to explain that.
Ba_diving mailing list: "Ba" stands for "Bay Area", not "Bare-Assed," diver, This is a discussion group for Bay Area divers. As with most of the Internet, "discussion" is a relative term. It can get a little heated occasionally, a lot silly sometimes, but there's much good information here, and a number of our Bay Area luminaries hang out here. There's been lots of discussion of the abalone ban and the Ed Ricketts Marine Park. There are regular (but more would be better) reports on conditions in Monterey and on the North Coast. To subscribe: go to the ba_diving home page (http://groups.yahoo.com/group/ba_diving/) and click "Join this group".
Ba_diving home page: (http://groups.yahoo.com/group/ba_diving/files/WebSite/index.html). This is the home page for the ba_diving list. It has many good links to other pages related to local diving: local dive shops and dive boats, places to stay in Monterey, etc.
Pt. Lobos Reservations: http://www.pointlobos.org/diving/reservations). First, check the official dive calendar for openings (Remember, the number provided on the calendar date refers to number of teams TAKEN, out of 15 total teams). Also, be aware that reservations have changed as of Jan 1, 2015. So check the dive regulations page. You can make reservations here up to two months in advance. For example, at one second after midnight on the morning of September 21st, you can make a reservation for November 21st. You need to name the team leaders, but the rest can be entered as "TBA." By the way, Pt. Lobos allows only 15 teams of two or three divers, so there can be as many as 30-45 divers. If you beat the crowd (I've made a reservation 10 minutes after midnight and been the sixth team), they will send you an e-mail with your team number(s) and where to send the check.
GPS: For information about using GPS for diving in Monterey, see http://www.garlic.com/~triblet/swell/gps.html.
Northern Californian Underwater Photographic Society: For information about the Northern California Underwater Photographic Society (NCUPS), see http://www.ncups.org.
Diving Singles: For information about Diving Singles, see http://www.garlic.com/~triblet/singles/.
Monterey Bay National Marine Sanctuary: http://bonita.mbnms.nos.noaa.gov/
Monterey Bay Boater's Forecast: http://www.wrh.noaa.gov/mtr/getcwfzone.php?sid=MTR&zone=PZ555
Monterey Bay Tide Table: (http://tbone.biol.sc.edu/tide/tideshow.cgi?site=Monterey%2C+Monterey+Harbor%2C+California) Tide information, good for entry planning at Coral St. and other rocky areas, and for launching at Pt. Lobos. May give some indication on tactical vis changes during the day especially in long shallow areas like Lovers, where the outgoing tide makes for bad vis.
Central California Weather Radar: (http://www.intellicast.com/Local/USLocalWide.asp?loc=ksfo&seg=LocalWeather&prodgrp=SevereWeather&product=RadarSummary&prodnav=none) Learning to read the weather radar takes a bit of practice, but it can give a good short-term indication of whether it will be raining.
National Weather Service San Francisco Bay Area Weather Page: <(http://www.wrh.noaa.gov/mtr/) This has lots of good weather forecasting information, including links to all of the following web sites which attempt to predict swell height and direction. Swells are the big long rollers that make surge and surf. These predictions are still somewhat imprecise, so don't get mad when they are wrong, but they're still better than my bunions. Use them to decide when to take a drive to Monterey, then check out conditions on the beach.
Global Wave Action Model (WAM): (http://www.fnmoc.navy.mil/PUBLIC/WAM/wam.html). The U. S. Navy's Fleet Numerical Meteorology and Oceanography Center burns a lot of supercomputer time predicting wave action around the world, presumably to keep all those expensive warships from getting battered in high seas. They make this information publicly available on this web site. Predictions go out six days, which makes this a good tool for deciding whether you MIGHT want to go diving this weekend, but predictions out that far are somewhat imprecise, so you should back it up with other sources as dive day nears. The web site has maps of the Pacific showing their predictions every twelve hours for the next five days. It's run by the military, so times are in Zulu (UT, previously known as GMT). Just remember that 1200 Zulu is 4 a.m. or 5 a.m. (depending on daylight savings) Pacific Time.
It's updated every twelve hours. Dark blue is good. The arrows showing swell direction are kind of small, but still usable. Ignore any really skinny bands along the coast.
The WAM works by taking current data from a number of sources, including buoys and satellite radar. It then does a numerical simulation out six days. It ignores the effects of shallow water (less than about 900 feet).
The Navy's page only allows you to look at one forecast (12 hour period at a time). Frustrated by this, I put together a page (WAMGlance) that shows thumbnails of all eleven forecasts, and allows you to easily scroll up and down in them. It's http://www.garlic.com/~triblet/swell/wamglance.html. It also shows the Monterey Bay Swell Model and has links to some surface forecasts. It takes a while to download all the graphics, but I find it a whole lot easier to use.
Note: the WAM says "wave" but really means "swell".
Coastal and Marine Forecast: (http://www.ndbc.noaa.gov/data/Forecasts/FZUS56.KMTR.html) The National Weather Service issues a coastal and marine forecast every few hours. This includes current swell heights and a prediction for 12 hours and 24 hours out. Locally, this includes forecasts for Pigeon Point (half way between Half Moon Bay and Santa Cruz) to Point Piedras Blancas (Hearst Castle), and for Monterey Bay. I usually use the former because the Monterey Bay forecast usually specifies a fairly wide range of swell heights in order to cover both the sheltered and unsheltered portion of the Bay. This forecast is worth checking the day before the planned dive and again before leaving home.
This forecast is also on the NWS radio network. The web-impaired can pick up a weather radio at Radio Shack or REI for about $40. It can also be received on most (all?) marine VHF radios. Before the web, my Radio Shack weather radio saved me a number of drives to Monterey and I still check the coastal and marine forecast from my boat before launching.
Monterey Bay Swell Model: (http://cdip.ucsd.edu/recent/model_images/monterey.png) This is a more or less real-time map of the Monterey Bay area (Ano Nuevo to Pt. Sur) showing swell heights with horizontal resolution of 200m (shallow water) to 800m (deep water). It also has what I call a bulls-eye chart that shows where the wave energy is coming from. The other resources only give an average direction, while this chart will show multiple sources, and show wave period. West swells would usually indicate that Monterey Bay, Monastery, and Pt. Lobos are pretty calm, but if "West" is really an average of Northwest and Southwest, there can still be some significant Northwest swells hitting these areas.
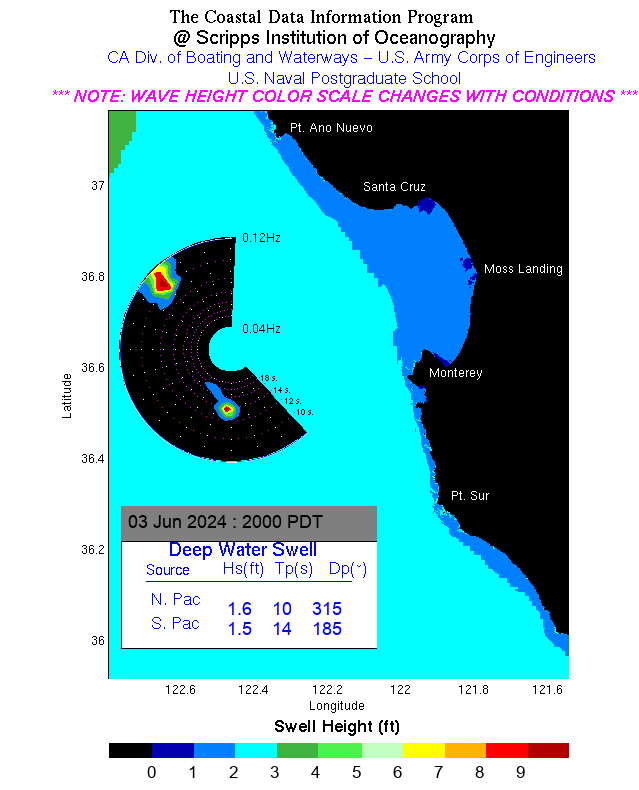
The model also shows the interval between the swells. An eight-foot swell with a five-second interval is really rockin and rollin on the surface. An eight-foot swell with a sixty-second interval would rock a baby to sleep. On the other hand, the longer the interval, the deeper the swells reach, but in general the reduced velocity more than cancels out the deeper reach, so longer is better. There's a nice explanation of this methodology (with specific examples in Southern California) at http://cdip.ucsd.edu/models/about_swell.html.
3-Day Offshore Wave Height Forecast (http://cdip.ucsd.edu/elnino_htmls/homepage.shtml) This plots the WAM model data (the numbers behind the pretty pictures) for a point about 46 n.m. west of Santa Cruz. It's useful for a quick check to see whether you should look at other forecasts.
3-Day Wave Height Maps (http://cdip.ucsd.edu/?nav=recent&sub=forecast)
This starts with WAM model data (the numbers behind the pretty
pictures)
for a point about 46 n.m. west of Santa Cruz. It then
predicts the
effect of shallow water on the swells the WAM's swells and draws maps
in the same format as the Monterey Bay Swell model, except that north
isn't
straight up. This allows it to forecast what areas will have
protection.
There's a good description of the methodology behind both 3-day forecasts at http://cdip.ucsd.edu/?nav=documents&sub=faq&xitem=nowcast.
To learn how to read the all this wave data, see http://www.garlic.com/~triblet/swell/Inet1XMP.html.
If you would like to learn more about all this, see Willard Bascom, Waves and Beaches, Anchor Books, 1980, ISBN 0-385-14844-5. Amazon.com lists it as "hard to find", but it's worth a shot. Bascom did a lot of the basic surveys of California beaches in the late 1940's using a DUKW, which is a big amphibious truck used by the military. The book includes a picture of Bascom surfing the DUKW at Carmel River State Beach on a day when I sure wouldn't dive.
http://garlic.com/~triblet/swell/index.html
Last updated: 12:42 PM, Sunday, February 22, 2015.
Webmaster: Jason Adelaars, jasonDOTmsbs@gmail